
Choosing the correct hypothesis test for your data is at times intimidating. Array of statistical hypothesis tests are available (parametric and non-parametric tests) based on sample size, data type and objective of hypothesis testing. Have you ever wondered which hypothesis test to use when the aim of business strategy or research intention is to improve overall performance and efficacy?
Let’s take a practical business problem. You are an up-coming fully e-commerce-based fashion website. As part of initial marketing campaigns primarily focused on creating buzz and widening the reach, you have invested in several online campaigns which included, social media campaigns, Display ads and influencer marketing channels. As a modern digital native, you have set-up target KPIs like # visits, product views, conversions etc. Over this line you have decided to go frugal and a choose the campaigns which generate quantifiably better results and invest more on those. As part of this tracking process, you have run tests on two channels namely Display ads and Influencers while keeping rest of the conditions (time of the day for posts, product ranges and overall messaging) constant. After measuring the KPIs for each of the channels in two specific campaigns, you have understood how much impact each channel and campaign had on your KPIs (measured as difference between Average KPI value vs actual KPI value resulting from each campaign).
In a traditional approach with simple t-test, you will try to find out statistical significance of the impact and if it falls within a certain confidence interval, you will say that the marketing channel used is providing significant impact on KPI value. But it does not provide information regarding which method is superior or inferior for which campaign with respect to your target KPIs cut-off. In such a case how will you decide which channel is superior or inferior?
Test of equivalence or Two-One Sided Test (TOST) is the answer. Test of equivalence is different from traditional hypothesis testing and one must be careful while defining Null hypothesis (H0) and Alternate hypothesis (H1).
In traditional hypothesis testing such as t-test, null hypothesis is defined in such a way that the two samples or measurements from two experiments have no significant difference. Alternative hypothesis will be the two samples are significantly different. In our example above, it will tell us if a campaign had a significant impact on our KPIs or not.
The Test:
TOST can be used for establishing equivalence or superiority or inferiority between two sets of observations. In a typical noninferiority study, the goal is to establish if a strategy (in our case marketing channel) is not inferior to the existing one (i.e., equivalent, or possibly superior). We will assume that higher values for KPIs are better. We can do this by looking at means of each strategy and then checking if the difference between the means is lying within a predefined range, So Null Hypothesis will state that if μi is the mean for influencer impact and μd is mean for display ads impact, then if μi – μd ≤ μlower then it will mean influencer channel is inferior to Display ads. or if μi – μd ≥ μupper then it will mean that Display channel is inferior to influencer channel.
Null and alternate hypothesis statements for different types of hypothesis tests.
| Type of Hypothesis test | Null hypotheses (H0) | Alternate hypothesis (H1) |
| Traditional comparative | There is no difference between the channels μi = μd | There is a difference between the channelsμi ≠ μd |
| Noninferiority(higher values are better) | Influencer channel is inferior to Display ads μi – μd ≤ μlower orDisplay channel is inferior to influencer channel. μi – μd ≥ μupper | Both strategies are equivalent μlower < μi – μd < μupper |
| Noninferiority(lower values are better) | Influencer channel is superior to Display ads μi – μd ≤ μlower orDisplay channel is superior to influencer channel. μi – μd ≥ μupper | Both strategies are equivalent μlower < μi – μd < μupper |
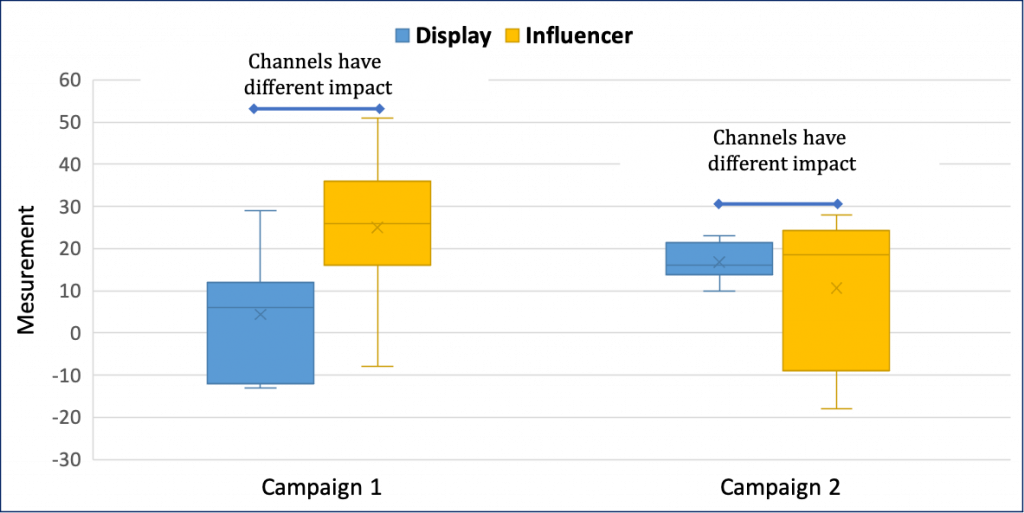
Traditional Approach:
As shown in table above traditional approach will just tell us that influencer and Display ads had different impact in both Campaign 1 and Campaign 2. The t-test fails to establish equivalence between two channels in case of Campaign 2.
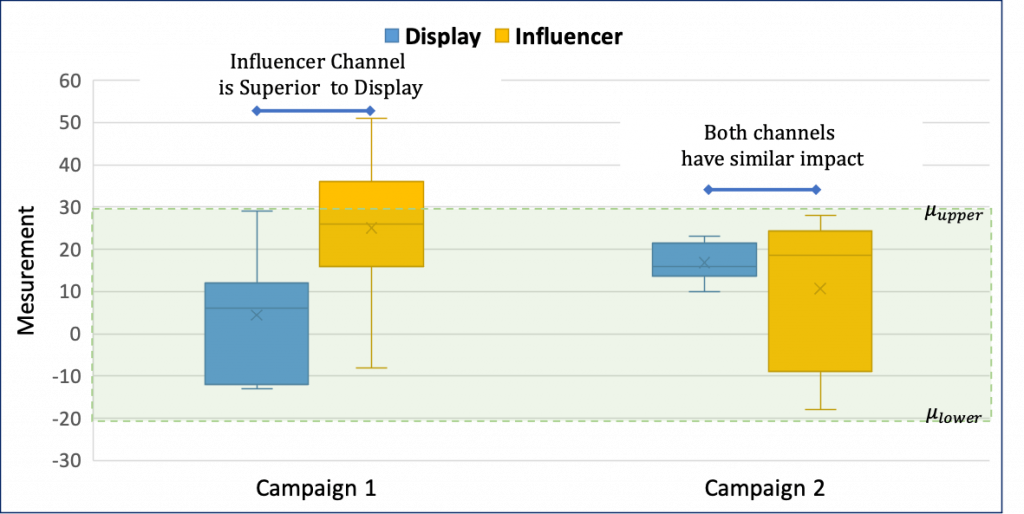
TOST Approach:
The acceptable range of values for your KPI are -20 to 30. TOST captures similarity in impact with respect to the lower and upper limit defined as well as provides additional information regarding superiority of a specific strategy:
For certain KPIs such as churn rate, bounce rate where lower values are better one must define null and alternate hypothesis exactly opposite to that of the above use case. Null hypothesis will be Influencer channel is superior to Display ads (when μi – μd ≤ μlower) or Influencer channel is inferior to Display ads channel (when μi – μd ≥ μupper). Alternate hypothesis will remain the same i.e. both strategies are equivalent.
Key questions to ask before going for TOST-
- What metrics are better lower or higher values? Important in defining your null and alternate hypothesis.
- What is the range for confidence interval? Define upper and lower limits for μ.
- Can we get enough observations or measurements? About 500 observations are desirable to produce reliable test results.
The main advantage of the TOST is that it is robust in establishing practicality and superiority of the business strategy one over the other, while other traditional methods which focus on mean/median may rule out support for null hypothesis. Limitation of the TOST is Power of the test. The test performance is accurate when you have at least 500 data points.
Python statsmodels.stats.weightstats provides function ttost_ind to perform TOST on the data. Find sample python code jupyter notebook here.
References/ Further reading
- Walker E, Nowacki AS. Understanding equivalence and noninferiority testing. J Gen Intern Med. 2011;26(2):192-196. doi:10.1007/s11606-010-1513-8
- Ialongo C. The logic of equivalence testing and its use in laboratory medicine. Biochem Med (Zagreb). 2017;27(1):5-13. doi:10.11613/BM.2017.001
- https://www.statsmodels.org/stable/generated/statsmodels.stats.weightstats.ttost_ind.html
- Shieh G. Exact Power and Sample Size Calculations for the Two One-Sided Tests of Equivalence. PLoS One. 2016 Sep 6;11(9):e0162093. doi: 10.1371/journal.pone.0162093.
For code in R
- https://towardsdatascience.com/equivalence-testing-b107979a65ae


This Post Has 4 Comments
Very well articulated. Very informative
Great work dear..well articulated
Great work dear..well articulated article
Thankfulness to my father who told me about this blog,
this weblog is really amazing.